Navigation
Install the app
How to install the app on iOS
Follow along with the video below to see how to install our site as a web app on your home screen.
Note: This feature may not be available in some browsers.
More options
You are using an out of date browser. It may not display this or other websites correctly.
You should upgrade or use an alternative browser.
You should upgrade or use an alternative browser.
2024 Pre-Election Political Polls | POLL - Trump would have had 7 point lead over Biden
- Thread starter nycfan
- Start date
- Replies: 5K
- Views: 193K
- Politics
- Messages
- 3,129
- Messages
- 37,883
lawtig02
Legend of ZZL
- Messages
- 5,657
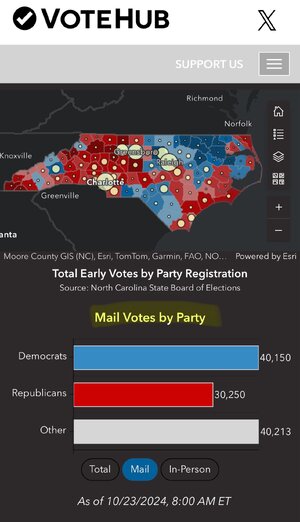
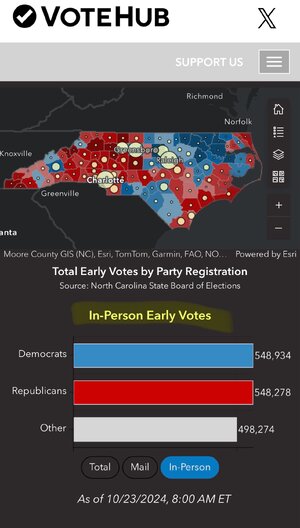
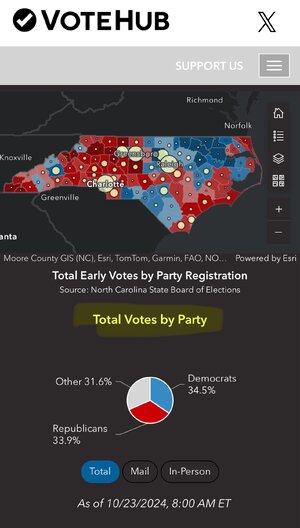
There's literally nothing less meaningful this year than early voting numbers.Stop reacting to party turnout in early voting!
The GOP is pushing it this year....so dont expect similar "D early, R on E Day" patterns. It may be very very very very different now and in the future.
superrific
Master of the ZZLverse
- Messages
- 11,758
Not even JD Vance?There's literally nothing less meaningful this year than early voting numbers.
Here's what I take from the early voting number. The R/D split tells you nothing. But the numbers to keep an eye on, especially in NC, is black turnout and women turnout. So far, the ladies are going to the polls a bit more than men. They also outnumber the men in the state by a surprising margin (it's in part a registration thing but also a population thing). And we know that there is a huge gender gap, and we're on the right side of it.
So if the women keep turning out in higher numbers than men, that will be a huge plus.
Second, black turnout. Right now, it's only a couple of points behind white turnout. That might be an artefact of the early voting events that the black political community has put together over the years, but in past elections the race turnout gap has been about 10-12%. If that turnout gap is 8%, it will be a huge deal -- even if Trump is winning a somewhat larger percentage of that vote. So that's encouraging.
The R/D tell you nothing because the election will be decided in large measure by the (I) vote, and the number of R registered voters who vote for Kamala (and vice versa). At the margins, R/D turnout is important but that's not something we can easily observe.
lawtig02
Legend of ZZL
- Messages
- 5,657
Fair enough, and I don't disagree with any of that. But I still don't think even those numbers are particularly relevant now. Let's see where things stand in a week. But even then, it really won't change my view on the election. It's close. Kamala is likely to win, but it's not a guarantee. And the down-ballot races could prove to be enormously consequential, especially in states like NC.Not even JD Vance?
Here's what I take from the early voting number. The R/D split tells you nothing. But the numbers to keep an eye on, especially in NC, is black turnout and women turnout. So far, the ladies are going to the polls a bit more than men. They also outnumber the men in the state by a surprising margin (it's in part a registration thing but also a population thing). And we know that there is a huge gender gap, and we're on the right side of it.
So if the women keep turning out in higher numbers than men, that will be a huge plus.
Second, black turnout. Right now, it's only a couple of points behind white turnout. That might be an artefact of the early voting events that the black political community has put together over the years, but in past elections the race turnout gap has been about 10-12%. If that turnout gap is 8%, it will be a huge deal -- even if Trump is winning a somewhat larger percentage of that vote. So that's encouraging.
The R/D tell you nothing because the election will be decided in large measure by the (I) vote, and the number of R registered voters who vote for Kamala (and vice versa). At the margins, R/D turnout is important but that's not something we can easily observe.
superrific
Master of the ZZLverse
- Messages
- 11,758
No, they aren't particularly relevant. I've been saying that for a while. I'm saying here that, to the extent that they are relevant, they look good to me, in NC at least.Fair enough, and I don't disagree with any of that. But I still don't think even those numbers are particularly relevant now. Let's see where things stand in a week. But even then, it really won't change my view on the election. It's close. Kamala is likely to win, but it's not a guarantee. And the down-ballot races could prove to be enormously consequential, especially in states like NC.
So if you're (not you specifically) inclined to care about this -- and for some people it's more reflexive than choice -- tune out the "Republicans are voting way more than in 2020" because that's just stupid. It's like comparing a UNC basketball team to 8-20. We're always going to be better than that, even if we objectively fail.
If you are inclined to care about this, focus on the variables that we can observe. We know that the female and AF-Am vote is going to be heavily in our favor. If those numbers are looking strong, it will probably be a good night.
- Messages
- 7,668

"Listen, I want to say something else really quickly. If you are believing the panic polls, stop it. Stop it. Donald Trump has done two strategic imperatives for the rest of this campaign. Number one, is to flood the zone with shit and panic Democrats. That's why you're seeing dozens of these polls from brand new pollsters and low quality pollsters and Rasmussen a thousand times over to skew the poll aggregate numbers.
Donald Trump is in real trouble across the country. He has very few bright spots on the map and a lot of very, very red alert spots. The disinformation machine that is feeding that panic narrative is making my Democratic friends lose their goddamn minds. Fucking stop it. The best piece of advice I've ever gotten in my personal life was don't drink the poison. Don't drink the poison.
When bad people want you to drink the poison, don't drink the poison. Don't drink the poison. I wrote about this the other day on Substack. The idea that you're going to get panicked and you're going to run for the hills because some polls don't look like you want them to look, grow up. Toughen up.
We can win this thing, and we can win it big. Get out there and vote. Vote early. That helps the Harris campaign. The sooner you vote, the better. And this disinformation stuff, the more you see the crazy, the more you need to dismiss the crazy, the more you need to filter it aggressively."
Macksbrownies
Exceptional Member
- Messages
- 122
“Other” is almost assuredly majority Democrat voting so I’m not worried about those numbers.
- Messages
- 7,668
Ha! Great point. They're kind of right, though, even if it's probably a little unseemly to acknowledge. I will confess that, as a former diehard Republican and as someone who still maintains ideological positions that are likely a little to the right of many of my new friends in the Democratic Party, I have become dismayed at the panicking and pearl-clutching. It is just completely antithetical to my nature. I am a big believer in projecting optimism confidence, even when one is internally nervous or anxious, so the negativity, pessimism, doomsdaying, apocalyptic prophesying, and "obeying in advance" has been driving me up a wall. But I have been trying to do a better job of having compassion, understanding, and empathy for the folks who are feeling any or all of those things. I've also come to the realization that not only is it not my place to tell others how they should feel about something as impactful as the election, but it also isn't my place to tell the Democratic Party how to do politics, since the party has been wiping the floor with the GOP in the popular vote for decades now.The Lincoln folks are all like "we used to make fun of you. Now we are with you and you are all fucking annoying"
superrific
Master of the ZZLverse
- Messages
- 11,758
That's in part because you don't have all that much at stake.I have become dismayed at the panicking and pearl-clutching.
Also, it's worth noting that you're relatively new to empathy politics. Don't get me wrong -- I'm glad to have you. But some of us have been looking at our political system through that lens for decades. And I'll tell you, there are few things more frustrating than wanting to do good in this world and having the government shut that down for essentially malicious reasons. And then we try to change things and we run into the Supreme Court in 2000, and the Electoral College bullshit, and the lying and disinformation.
There's a famous Onion article about George W Bush's inauguration. The headline is something like "Bush at inauguration: 'Our Long National Nightmare Of Peace And Prosperity Is Over." Yep. They called Bush's presidency before it began. And it's so fucking frustrating to watch W wreck the country, Obama has to try to put it back together, and then the chaos monkeys and watch-the-burn types come up with Donald Trump. Hey assholes! Your lives are good under Dems. Hey autoworkers, we get it, you don't like Mexicans but hey how did it feel when GM was about to fail and Obama saved it? Remember that?
Now, I always say, being a liberal is hard work. We're not here because it's easy. If we wanted easy, we'd go work in corporate America, buy a house in the burbs and a Beamer or two and vote GOP (for the more upwardly mobile of us). We're here because it's worth doing, and everything that's worth doing is hard. Well, the pearl clutching is a side effect of that. It's a side effect of working hard (mentally and sometimes physically), staying optimistic enough to believe in progress however gradual, keeping other peoples' concerns in mind as you navigate difficulties in your life -- and then watching the assholes who always have it easy, who take the easy way out at every opportunity, somehow manage to pull it out in the end.
In other words, we find ourselves frequently in the position analogous to watching a Duke basketball game. Duke can be beaten, but it's so frustrating to watch them getting clocked and then having the refs jump in to save them. Don't tell me you're never fatalistic about that. Don't tell me you've never thought, "here come the refs" when watching a Duke game.
- Messages
- 7,668
Completely and totally fair points.That's in part because you don't have all that much at stake.
Also, it's worth noting that you're relatively new to empathy politics.
treblkickd
Member
- Messages
- 18
1. I think there is a pretty solid consensus that today's prediction markets are worse than forecasting models. That's not a law of nature; better prediction markets could yield better information. Most of the positive evidence for prediction markets comes from decades ago; our recent experience is that prediction markets don't work very well for reasons I've already outlined in some detail.
2. If a person is comparing polls to prediction markets, then obviously the prediction markets will do better because polls are not predictions. Polls are snapshots. That doesn't make prediction markets good. It just means that the analyst is lazy. Comparing a snapshot to a prediction is ridiculous.
3. 538 tried to have that honest discussion a few years ago. I don't think I was convinced by it, but it wasn't unreasonable.
Basically, what they did was test their predictive ability by evaluating all of their predictions -- including the sports predictions that the site used to make. They treated an election forecast as a stream of serial individual forecasts from start to finish. And they tried to see if something they predicted to be 75% likely would in fact occur 75% of the time.
Unsurprisingly, they came out with pretty good results. I question the mash-up of sports and politics. Sports predictions are much easier than political predictions. There are many fewer variables. But it's also true that expanding their sample size is a good idea, so you know, it's hard to assess. I'm also not sure about the election forecast as a series of individual forecasts. They weighted it down in some way so that, say, the presidential election forecast didn't swamp all the other forecasts by virtue of being 300 forecasts in a row. I also don't remember if it was only a binary outcome being measured. I think it was.
I also am skeptical of the serial forecast approach, but that's a long discussion.
4. Ultimately, I think the problem is epistemic rather than statistical (and you might be making that point as well). Suppose the model gives candidate A a 90 % chance to win on September 1. By September 15, something happened and the probability goes to 60%. I don't think this should be equivalent to two predictions of 75%. Now, the question is whether the "something happened" should be held against the 90% estimate. On one hand, you could say that it should -- after all, it's trying to make predictions. But the result is that the model builds in tons of uncertainty, and that dilutes its usefulness. Indeed, the models just won't predict 90% in August unless the race is truly out of control.
And the second question, which I think is philosophical, is what we consider good performance. Suppose there's a model that has A's chances hovering around 60% for three months. At the very end of the election, there's an event that pushes A's chances to 70% and A wins. Suppose there's another model that builds in less uncertainty. It has A's chances at 30% for all of August, September and most of October. Then, after the event, this model says that A is 85% likely to win. Why do we care if it had A at 30% in August? The thing that propelled A hadn't happened yet. Isn't the 85% figure what we really care about?
I think this is one of those instances where Nate & Co decided they needed to measure their performance (a good instinct!), but the only way they could figure out how to do a measurement that isn't absurd is this serial approach, so the phenomenon that I'm sure you encounter a lot -- we measure what we can, and then we interpret what we have measured -- probably applies here. Is a bad measurement better than no measurement?
I was really just thinking about statistical tests of models, in part because the models themselves are often changing, which is not surprising given the numerous ad hoc components they have to include. Also, the model predictions for different elections are using wildly different input data---presidential elections are much more densely polled, for example, than local elections. So both the models and methodology to generate the input data (i.e., polls) are being changed over time. It therefore does not make sense to average together results from multiple election cycles or different elections to draw conclusions about how accurate models are likely to be in future elections. It's kind of like if you drove three entirely different car models over the course of your life and you averaged your lifetime gas mileage, and then went and bought a new car and expected that lifetime average gas mileage to accurately predict the gas mileage of your new car. Not a perfect analogy but I think it captures the gist of the problem.
The epistemic problem that you raise is also a good one, and I think is especially relevant if you're comparing things like polls to betting/prediction markets, because those two broad categories of things are not even trying to do the same thing and so comparing them is nonsensical. Or to put it another way, no poll has, itself, ever predicted the outcome of an election. That's not what polls are designed to do (at least not as far as I'm aware). A prediction is an interpretation that a person might make based on a poll, but the poll itself is fundamentally a snapshot estimate of how the voting would be likely to go during the window of the poll. A betting market, on the other hand, is something like a crowd-sourced attempt to predict the outcome of the election. Predictive models (538 and the like) could be sensibly be compared to betting markets, I guess, but even then it's not actually trivial to establish what predictions you want to compare. For a given election all you really care about is who won, but for evaluating the accuracy (and precision!) of a given prediction method you'd want to look at quantities such as the final vote %-age, and for presidential elections the EC outcome - this is pretty much exactly the difference b/w comparing something like the old RPI vs Barttorvik or Kenpom.
lawtig02
Legend of ZZL
- Messages
- 5,657
Fine, whatever, Joe. Call the race tied. Run through the finish line. Blah, blah, blah.
Look, Kamala is in great shape to win this election. Trump is sucking wind. Could he win? Sure. If he does, the consequences for our nation would be extraordinarily dire. But I'll say right now, it's not going to happen. Kamala will win. It may be close, or it may be a landslide, but one way or another, Kamala will win this election. So I'm done with the "tied race" thing. Come on, Joe! Call your shot! It's Kamala. We've got this.
- Messages
- 7,668
Fine, whatever, Joe. Call the race tied. Run through the finish line. Blah, blah, blah.
Look, Kamala is in great shape to win this election. Trump is sucking wind. Could he win? Sure. If he does, the consequences for our nation would be extraordinarily dire. But I'll say right now, it's not going to happen. Kamala will win. It may be close, or it may be a landslide, but one way or another, Kamala will win this election. So I'm done with the "tied race" thing. Come on, Joe! Call your shot! It's Kamala. We've got this.

- Messages
- 3,129
From your lips to God's earsFine, whatever, Joe. Call the race tied. Run through the finish line. Blah, blah, blah.
Look, Kamala is in great shape to win this election. Trump is sucking wind. Could he win? Sure. If he does, the consequences for our nation would be extraordinarily dire. But I'll say right now, it's not going to happen. Kamala will win. It may be close, or it may be a landslide, but one way or another, Kamala will win this election. So I'm done with the "tied race" thing. Come on, Joe! Call your shot! It's Kamala. We've got this.
Share:


