Navigation
Install the app
How to install the app on iOS
Follow along with the video below to see how to install our site as a web app on your home screen.
Note: This feature may not be available in some browsers.
More options
You are using an out of date browser. It may not display this or other websites correctly.
You should upgrade or use an alternative browser.
You should upgrade or use an alternative browser.
Approval/Disapproval Polls
- Thread starter nycfan
- Start date
- Replies: 1K
- Views: 62K
- Politics
BillOfRights
Iconic Member
- Messages
- 1,452
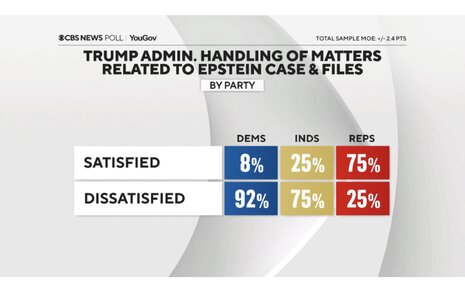
That first chart is telling.
There is no way to objectively say that the trump administration has handled matters relating to the Epstein files and case satisfactorily.
If 75% of republicans are satisfied with the way the trump administration has handled the Epstein files in case, that's the number that would stick with him even if he raped a 12-year-old on 5th Avenue.
sringwal
Iconic Member
- Messages
- 2,155
To follow up:

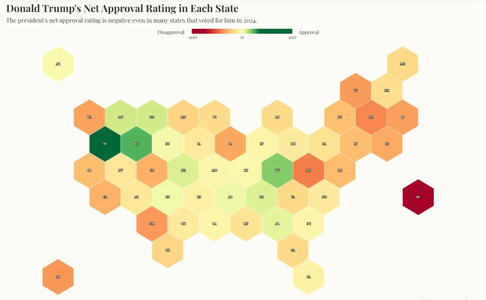
Donald Trump's approval rating negative in 20 states he won
Trump's approval rating is underwater in 20 states he won in the November 2024 presidential election.
- Messages
- 2,463
It’s a hotbed of white nationalism.Avoid places in green... Outside of Yellowstone
I mean goodness Idaho is insane
gtyellowjacket
Inconceivable Member
- Messages
- 2,950
But why the swing? Did all those green States suddenly have a lot of racists emigrate in the last 8 months? Did they all come from Oklahoma and Mississippi?It’s a hotbed of white nationalism.
I think there has to be a different explanation if this graphic is right on why some states love Trump even more and most States love Trump much less. If I had to guess, it would be having to do with the rate that these different states are polled. Maybe there just haven't been too many recent ones in the green States.
The green states are the most racist states. Idaho and West Virginia are definitely the most racist states in the country. The more racist you are, the better you think Donald Trump is performing.But why the swing? Did all those green States suddenly have a lot of racists emigrate in the last 8 months? Did they all come from Oklahoma and Mississippi?
I think there has to be a different explanation if this graphic is right on why some states love Trump even more and most States love Trump much less. If I had to guess, it would be having to do with the rate that these different states are polled. Maybe there just haven't been too many recent ones in the green States.
gtyellowjacket
Inconceivable Member
- Messages
- 2,950
I'm skeptical. This graphic doesn't measure how much the average someone in a state loves Trump. It measures how many more or less people like Trump.The green states are the most racist states. Idaho and West Virginia are definitely the most racist states in the country. The more racist you are, the better you think Donald Trump is performing.
So if its the racist theory then either racists in the green states didn't like him before but now they do or a whole lot of racists that liked Trump all along suddenly moved into those green states. I can't see why either of those two things would be true.
gtyellowjacket
Inconceivable Member
- Messages
- 2,950
No. I'm wrong. Its not a change in approval rating. Its the spread between approval and disapproval. For example 54% disapprove and 46% approve would be a red 8.I'm skeptical. This graphic doesn't measure how much the average someone in a state loves Trump. It measures how many more or less people like Trump.
So if its the racist theory then either racists in the green states didn't like him before but now they do or a whole lot of racists that liked Trump all along suddenly moved into those green states. I can't see why either of those two things would be true.
So your racism theory would be possible. I don't think its correct looking at states like Mississippi and Oklahoma but its possible.
gtyellowjacket
Inconceivable Member
- Messages
- 2,950
Yeah. I'm wrong. Its the spread between approval and disapproval.
Idaho and West Virginia put Mississippi and Oklahoma to shame when it comes to racism. Like AAA vs. the majors.No. I'm wrong. Its not a change in approval rating. Its the spread between approval and disapproval. For example 54% disapprove and 46% approve would be a red 8.
So your racism theory would be possible. I don't think its correct looking at states like Mississippi and Oklahoma but its possible.
gtyellowjacket
Inconceivable Member
- Messages
- 2,950
Idaho and West Virginia put Mississippi and Oklahoma to shame when it comes to racism. Like AAA vs. the majors.
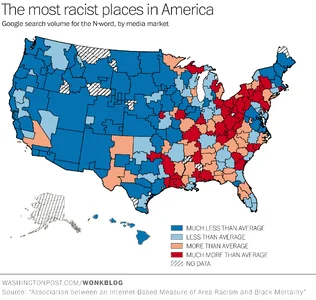
Is there hard evidence for that? This is from a ten year old Washington Post article. The data scientist measured how often people use the n-word during google searches. WV is there along with much of the South and rural northeast but not so much in Idaho.
Share:

