Grocery, Housing & Daycare Prices & Working Class Americans

nycfan

Master of the ZZLverse
ZZL Supporter
Messages
24,843
I posted this in the Current Events thread but it really struck a chord with me due to some recent personal experiences:


Just this past Sunday, I stopped at a grocery store I had not previously visited in a less well off part of my county on my way home from the mountains to grab a few things for the week. It is a very nice Ingles. But by some coincidence there were two different families circling the aisles at the same time I was and I couldn’t help but overhear both families having separate pressure due to grocery prices.

One family had their kids with them and were more in a constant put that back, everything costs so much you only get one treat and then the parents were huddled in the meat aisle talking about how they could save on meat to get something for the kids.

The other was a couple having a tense back and forth about their grocery list and prices. Several times the guy picks up something and loudly declares how expensive it is and the wife retorts with some version of see, I keep telling you, we can’t get a week’s groceries on this budget. I keep telling you I can’t afford this And that, we have to make do.

I’ve also heard repeatedly from elderly relatives how shocking grocery prices are for a few bags of food.

I know the data shows that wages have also increased dramatically. And I know the working class is always struggling to meet monthly budgets and pay all the bills. That was my family for a long time when I was a kid. For years I kept a running tally of the $$ in our cart because we had a very fixed budget that had to be stretched and plenty of times my mom made me double check my total and then had to go back through the cart and either put stuff back or trade down to a cheaper option. I learned basic division very early to help sort out the price per unit of different size packages and got a calculator for one Christmas (when a handheld calculator was still expensive, at least to us) to share with my mom not just for school (when we were still doing basic grade school multiplication tables and math so I didn’t even need a calculator) but also to help with the grocery tallies and for my mom balancing the checkbook before going grocery or clothes shopping.

But I’ve also been insulated from any pain of grocery costs for decades now, and I admit I seem too focused on macroeconomic data that suggests that wages and grocery costs are historically out of whack, but a lot of Americans are individually having a very different experience (maybe because the historic cost of housing is high now, which is pressuring everything else?).

Anyway, we’ve played political football with egg prices, which had external but seasonal inflationary pressures from bird flu resulting in wild price swings, but it seems there is something more serious afoot. And grocery prices seem to be a flashpoint for working class Americans.

But what can be done?
 
Last edited:
Background grocery inflations stats:

 
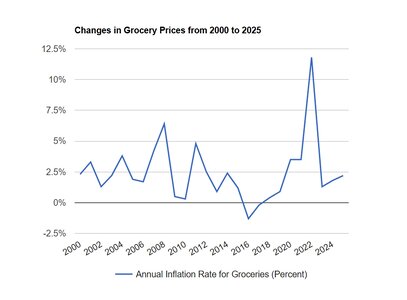
grocery3.jpeg

The 2022 grocery inflation wasn't the worst ever, but it had been nearly 50 years since Americans experienced anything like it and very low inflation (and even deflation!) had been the rule of thumb since the mid-90s, except during the Great Recession era.
 
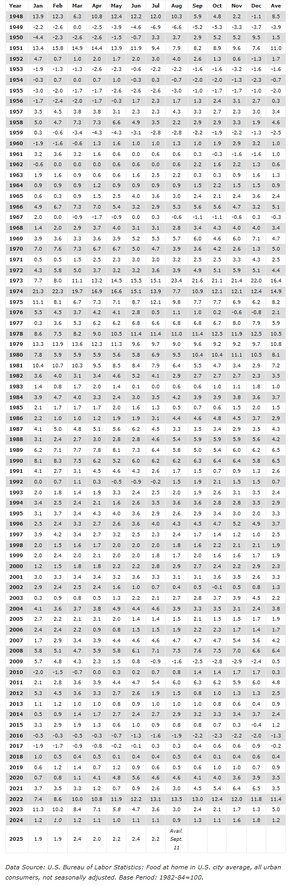
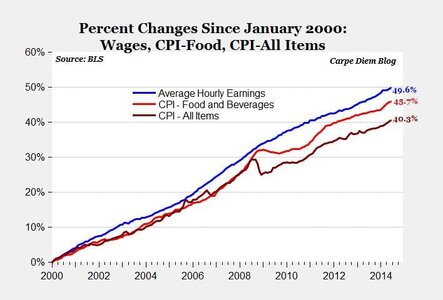
Here is the point that politicians and economists keep making to consumers (wage inflation has outpaced CPI) and consumers keep screaming they are feeling it differently than this chart indicates:

food3.jpg

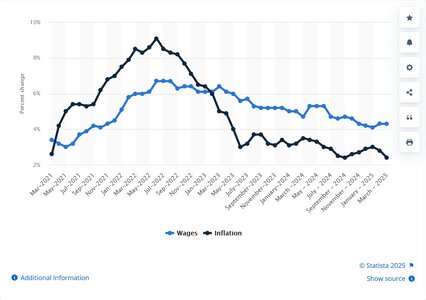
But this chart suggests that people are still reeling from the inversion of wage inflation and the inflation rate generally in the post-pandemic disruption:

Difference between the inflation rate and growth of wages in the United States from March 2020 to March 2025​


wage v cpi.jpeg

 
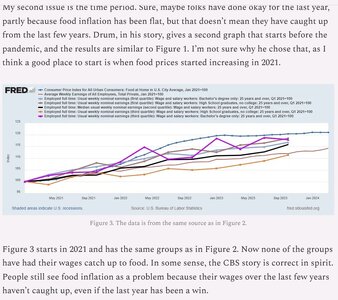
food4.jpeg

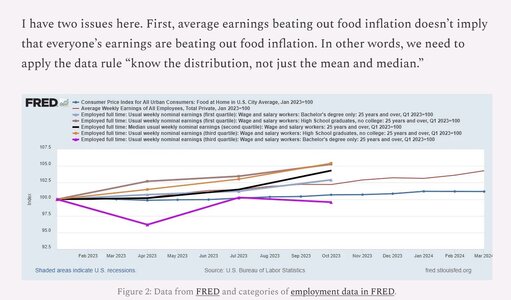
"... Figure 2 has the original data from Figure 1 in the red and blue lines but adds weekly earnings for different groups and percentiles. Unfortunately, that data stops in Oct 2023, but it still serves our purpose. The additional lines are not seasonal-adjusted data, but we can still get the idea. The black line is the median for all workers aged 25 and older. Interestingly, it is above the mean of all employees. Lines with squares are high school graduates, and triangles are college graduates. Note the bright pink line, which is the third quartile of college graduate earnings and is below food at home. The main point here is that just because the average wage is above food inflation, that doesn’t mean everyone is."


food5.jpeg
 
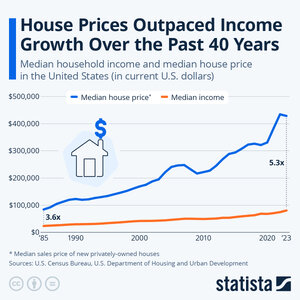
I suspect this is a bigger part of the price crunch, but rent or mortgage payments are generally stable, at least a year at a time for rent and adjustable rate mortgages, and longer term for fixed mortgages (as long as you don't move), while people directly experience changes in grocery prices on a weekly basis:

house v wages.jpeg

 
Also this, but again, the grocery prices are experienced weekly (or more frequently), while the change in daycare costs happens somewhat more gradually (annually):


"U.S. families spend between 8.9% and 16.0% of their median income on full-day care for just one child, with annual prices ranging from $6,552 to $15,600 in 2022, the most recent year for which data are available. Even part-day care for school-aged children (e.g., before and after school care) comprises 8.1% to 9.4% of median family income: From $5,943 up to $9,211 for just one child. To put this into perspective, the median cost of a year’s worth of rent was $15,216 in 2022."
 
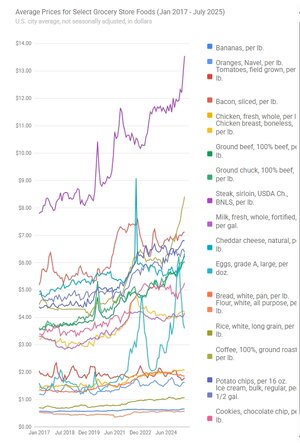
Not to derail, but I feel like bananas haven't increased price in 30 yrs.
your perception matches mine and the general data:


There has been minimal banana inflation for decades, but (adjusted for inflation) bananas are significantly cheaper now ($0.66/pound) than they were in 1980 ($0.79/pound).

scale GIF
 
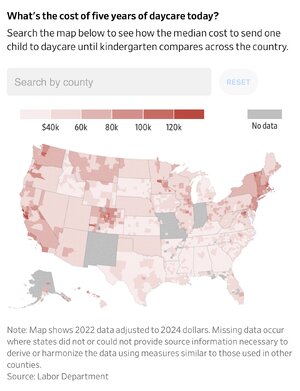
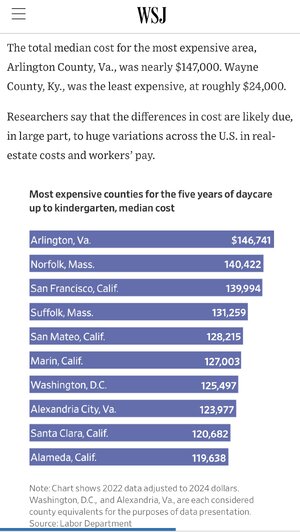
Turns out that WSJ has an interactive chart reflecting staggering daycare costs today:

From $24,000 to $147,000: How Much Daycare Costs Across America​

For working parents, the first five years of a child’s life are often the most financially draining. Explore this interactive map to see how costs vary around the U.S.​

🎁 —> https://www.wsj.com/personal-financ...0?st=jhFYG7&reflink=desktopwebshare_permalink

IMG_9041.jpeg

IMG_9042.jpeg

Note these figures are an aggregate FIVE YEARS of day care, not cost per year.

Child Care in America Is Broken. Here Are Five Ideas for How to Fix It.​

Parents are paying more than they can afford, but daycares and preschools can barely make ends meet. It is a market failure—but it doesn’t have to be.​


🎁 —> https://www.wsj.com/personal-financ...4?st=VBQB7p&reflink=desktopwebshare_permalink
 
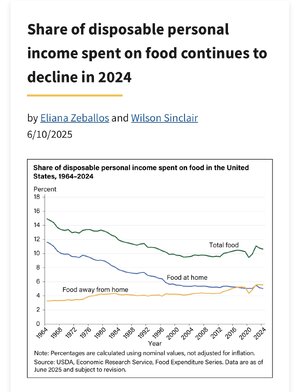
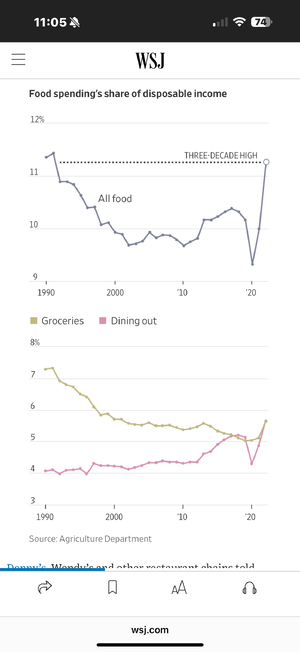
What's interesting to me is that at-home food has declined steadily as a percentage of the household budget over the past century. In 1900, it was about 40%. In 1970, it was 20%. Today, it's approximately 5%, and it actually declined from 5.2% last year, according to the USDA.

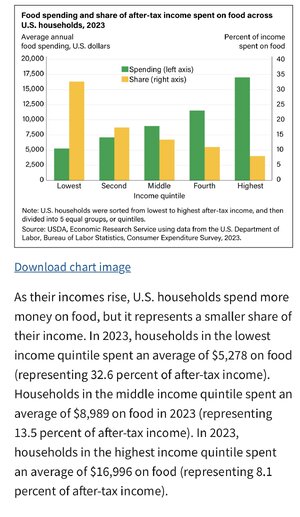
What has increased exponentially for households - and backed up by the article in the first post - are housing and health care costs. Because those two now take up such a large part of the household budget, my theory is that any increases are felt disproportionately among lower income households.
To your point:


IMG_9043.jpeg
 
Here is the point that politicians and economists keep making to consumers (wage inflation has outpaced CPI) and consumers keep screaming they are feeling it differently than this chart indicates:

food3.jpg

But this chart suggests that people are still reeling from the inversion of wage inflation and the inflation rate generally in the post-pandemic disruption:

Difference between the inflation rate and growth of wages in the United States from March 2020 to March 2025​


wage v cpi.jpeg


The average income in NC is $85,000. The median is $39,000.

The averages are going to be misleading.

1000018058.jpg
 
To your point:


IMG_9043.jpeg
But this article cites a study with a very different result:


“… New research by price-tracking website PriceListo, revealed that Americans spent a significantly larger portion of their income on groceries in 2024 than 10 years ago.

The study examined food inflation in America over the past decade, focusing on the rising cost of groceries. It analyzed the cost of living by state in 2024 compared to 2014, highlighting the states with the highest and lowest grocery prices relative to household income.

According to the findings, the average American household spent $13,653.36 annually on groceries in 2024, up from $10,247.76 in 2014. This marks a 33.3 percent increase in grocery spending over the past decade.

Meanwhile, the average household income has remained relatively stagnant, decreasing slightly from $68,996 in 2014 to $68,836 in 2024. As a result, the average percentage of income spent on groceries has risen from 14.9 percent in 2014 to 19.8 percent in 2024.


Mississippi residents spend the greatest percentage of income in groceries at 30.8 percent, followed by Louisiana (28 percent). New Mexico, Alabama and Oklahoma round out the top five at 27.3, 26 and 25.8 percent, respectively.

Conversely, New Hampshire residents spend the lowest percentage of their income on groceries at 13.9 percent, followed by Maryland (15.2 percent). Massachusetts, New Jersey and Connecticut rounded out the bottom five at 15.6, 15.8 and 16.3 percent, respectively. …”

🤷‍♀️
 
The average income in NC is $85,000. The median is $39,000.

The averages are going to be misleading.

1000018058.jpg
To your point


IMG_9045.jpeg
 
To your point:


IMG_9043.jpeg
🎁 —> https://www.wsj.com/economy/consume...d?st=GE38sW&reflink=desktopwebshare_permalink

IMG_9046.png
 

McDonald’s to Cut Combo-Meal Prices After Convincing Franchisees​

Burger chain working to improve its affordability, after consumers recoiled from escalating restaurant menu prices​


🎁 —> https://www.wsj.com/business/hospit...1?st=KGeALd&reflink=desktopwebshare_permalink

“… After pitching operators on the plan, McDonald’s and its U.S. franchisees agreed to keep the cost of eight popular combo meals 15% below the sum of the individual items’ prices, according to company materials viewed by The Wall Street Journal. The chain also will run $5 breakfast and $8 Big Mac and McNugget combo-meal specials later this year, marketing them as Extra Value Meals.

The move is part of the chain’s push to restore its reputation for affordability, which has taken a hit with cash-strapped consumers. McDonald’s has said that its new McValue deal menu is helping, but many consumers still feel the chain’s menu prices overall are too high.…”
 
Back
Top