Navigation
Install the app
How to install the app on iOS
Follow along with the video below to see how to install our site as a web app on your home screen.
Note: This feature may not be available in some browsers.
More options
You are using an out of date browser. It may not display this or other websites correctly.
You should upgrade or use an alternative browser.
You should upgrade or use an alternative browser.
2024 Pre-Election Political Polls | POLL - Trump would have had 7 point lead over Biden
- Thread starter nycfan
- Start date
- Replies: 5K
- Views: 194K
- Politics
- Messages
- 38,569
An increasing number of professional pollsters are raising the herding alarm:
It’s possible the tied race reflects not the sentiments of the voters, but rather risk-averse decision-making by pollsters

 www.theguardian.com
“… This near-monolithic picture, emerging from multiple polls, has triggered suspicions among some analysts of “herding” around state poll averages by pollsters cautious of being proved wrong for the third time running after significantly underestimating Trump’s support in 2016 and 2020.
… Of the last 321 polls in the battlegrounds, 124 - nearly 40% - showed margins of a single point or less, the pair wrote. Pennsylvania was the most “troubling” case, with 20 out of 59 polls showing an exact tie, while another 26 showed margins of less than 1%.
This indicated “not just an astonishingly tight race, but also an improbably tight race”, according to Clinton and Lapinski.
Large numbers of surveys would be expected to show a wider variety of opinion, even in a close election, due to the randomness inherent in polling.
The absence of such variation suggests that either pollsters are adjusting “weird” margins of 5% or more, Clinton and Lapinski argued – or the following second possibility, which they deemed more likely.
“Some of the tools pollsters are using in 2024 to address the polling problems of 2020, such as weighting by partisanship, past vote or other factors, may be flattening out the differences and reducing the variation in reported poll results,” they write.
Either explanation “raises the possibility that the results of the election could be unexpectedly different than the razor-close narrative the cluster of state polls and the polling averages suggest”, they added. …”
Dead-heat poll results are astonishing – and improbable, these experts say
It’s possible the tied race reflects not the sentiments of the voters, but rather risk-averse decision-making by pollsters

Dead-heat poll results are astonishing – and improbable, these experts say
It’s possible the tied race reflects not the sentiments of the voters, but rather risk-averse decision-making by pollsters
“… This near-monolithic picture, emerging from multiple polls, has triggered suspicions among some analysts of “herding” around state poll averages by pollsters cautious of being proved wrong for the third time running after significantly underestimating Trump’s support in 2016 and 2020.
… Of the last 321 polls in the battlegrounds, 124 - nearly 40% - showed margins of a single point or less, the pair wrote. Pennsylvania was the most “troubling” case, with 20 out of 59 polls showing an exact tie, while another 26 showed margins of less than 1%.
This indicated “not just an astonishingly tight race, but also an improbably tight race”, according to Clinton and Lapinski.
Large numbers of surveys would be expected to show a wider variety of opinion, even in a close election, due to the randomness inherent in polling.
The absence of such variation suggests that either pollsters are adjusting “weird” margins of 5% or more, Clinton and Lapinski argued – or the following second possibility, which they deemed more likely.
“Some of the tools pollsters are using in 2024 to address the polling problems of 2020, such as weighting by partisanship, past vote or other factors, may be flattening out the differences and reducing the variation in reported poll results,” they write.
Either explanation “raises the possibility that the results of the election could be unexpectedly different than the razor-close narrative the cluster of state polls and the polling averages suggest”, they added. …”
EhringhausSouth
Distinguished Member
- Messages
- 273
I'm gonna stick with my original prediction on the other thread I started but man, I am starting to sense a Harris EC landslide.
- Messages
- 38,569
Harris and Trump Woo Americans Who Don’t Even Know if They Will Vote
There are far more people who haven’t decided whether to vote than those who just haven’t picked a candidate
GIFT LINK —>. https://www.wsj.com/politics/electi...be?st=4VGzSQ&reflink=mobilewebshare_permalink
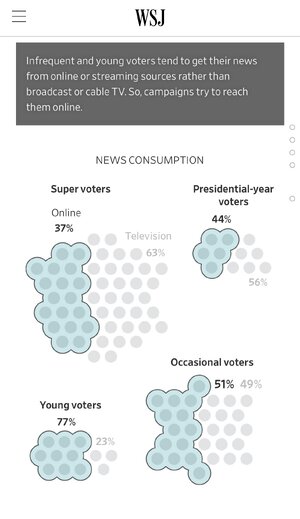
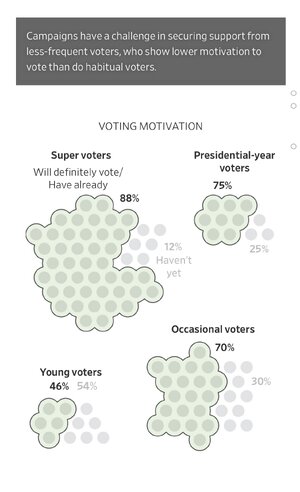
“… Most occasional voters—those who sometimes cast ballots and sometimes skip elections—lean toward one candidate or the other, and the campaigns see them as a vital source of untapped support. They account for more than one-quarter of the voter pool, strategists say, though estimates vary. By contrast, Wall Street Journal polling finds that only 3% of registered voters are truly undecided on a choice of candidate.
…
Habitual voters, those who showed up for the last two presidential and two midterm elections, have favored Harris over Trump by at least 4 percentage points in every Journal survey this year that tested her as a presidential candidate. That means that Trump is looking to the other half of the voter pool to make up those 4 or more points.
He holds a substantial lead among several categories of infrequent voters. For instance, the Journal’s late-October survey found Trump ahead of the vice president by 14 points among voters who cast ballots in the last two presidential elections but skipped the last two midterms. He led by 10 points among those who were old enough to vote in the last two presidential elections but skipped one or both of them.
Harris holds an even bigger advantage, of about 20 points, among another group that shows low motivation to vote: Voters under the age of 26, who were too young to cast ballots in one or both of the last two presidential elections. …”
- Messages
- 2,764
It’s just crazy to me that there are so many people who take their right to vote for granted and opt out. I guess it’s also crazy to me that people vote for someone like Trump, but I just don’t get not voting at all.Harris and Trump Woo Americans Who Don’t Even Know if They Will Vote
There are far more people who haven’t decided whether to vote than those who just haven’t picked a candidate
GIFT LINK —>. https://www.wsj.com/politics/electi...be?st=4VGzSQ&reflink=mobilewebshare_permalink
“… Most occasional voters—those who sometimes cast ballots and sometimes skip elections—lean toward one candidate or the other, and the campaigns see them as a vital source of untapped support. They account for more than one-quarter of the voter pool, strategists say, though estimates vary. By contrast, Wall Street Journal polling finds that only 3% of registered voters are truly undecided on a choice of candidate.
…
Habitual voters, those who showed up for the last two presidential and two midterm elections, have favored Harris over Trump by at least 4 percentage points in every Journal survey this year that tested her as a presidential candidate. That means that Trump is looking to the other half of the voter pool to make up those 4 or more points.
He holds a substantial lead among several categories of infrequent voters. For instance, the Journal’s late-October survey found Trump ahead of the vice president by 14 points among voters who cast ballots in the last two presidential elections but skipped the last two midterms. He led by 10 points among those who were old enough to vote in the last two presidential elections but skipped one or both of them.
Harris holds an even bigger advantage, of about 20 points, among another group that shows low motivation to vote: Voters under the age of 26, who were too young to cast ballots in one or both of the last two presidential elections. …”
- Messages
- 73
Hell, 2020 was the first time since 1968 that over 60% of the general population voted. In the 9os, it got below 50%.
The electoral college is so stupid.
Raijin23
Active Member
- Messages
- 49
Although my father got me to loosely follow presidential races around the time of Clinton's first race when I was around 13, I didn't start to care about politics and how it affected me until 2012.It’s just crazy to me that there are so many people who take their right to vote for granted and opt out. I guess it’s also crazy to me that people vote for someone like Trump, but I just don’t get not voting at all.
I voted for Obama in 2008 but that was more because it was a historic election that I wanted to be a part of. By the time 2012 had rolled around, I more awareness and participation in all things political.
Needless to say, 2016 and Trump's victory was the catalyst for me following politics 24/7 so that I can better understand how it will affect me, my family, my community and my country.
My point is that, for some, it takes a while to become engaged when you don't really see how it will affect you personally or even others.
- Messages
- 3,794
polls don't matter at this point because they cannot predict:
ground game turnout
late breaking "undeciders"
I'm counting on Harris having the superior ground game
I'm counting on election day undeciders breaking for Harris
ground game turnout
late breaking "undeciders"
I'm counting on Harris having the superior ground game
I'm counting on election day undeciders breaking for Harris
- Messages
- 3,794
You may not blame them, but I blame any voter ( and especially young voters because it is their future that hangs in the balance ) for not votingA certain amount of young people, at least in my cohort, don’t think it will make a difference if they do or don’t vote.
Can’t really blame them. It’s unlikely that their vote will matter unless they live in a swing state. Young women bucking the trend since they’ve actually seen a right taken away by a president.
- Messages
- 3,998
I have a 21 ish year old "extended family member" that lives in a moderate size town He makes a living with some trade skills-has some buddies-a nice family of origin. I doubt he has ever considered voting. I Imagine his role model Dad has never voted.Although my father got me to loosely follow presidential races around the time of Clinton's first race when I was around 13, I didn't start to care about politics and how it affected me until 2012.
I voted for Obama in 2008 but that was more because it was a historic election that I wanted to be a part of. By the time 2012 had rolled around, I more awareness and participation in all things political.
Needless to say, 2016 and Trump's victory was the catalyst for me following politics 24/7 so that I can better understand how it will affect me, my family, my community and my country.
My point is that, for some, it takes a while to become engaged when you don't really see how it will affect you personally or even others.
I suspect if he did he would vote like a trade skills white boy in the red state he lives in
RockyMtnHoo
Distinguished Member
- Messages
- 495
Ted Cruz probably breathing a sigh of relief.
Wouldn’t that mean TX is on pace for about 500K more votes this year? I would think that’s not a good thing for Cruz.
lightbluenc
Honored Member
- Messages
- 778
- Messages
- 38,569
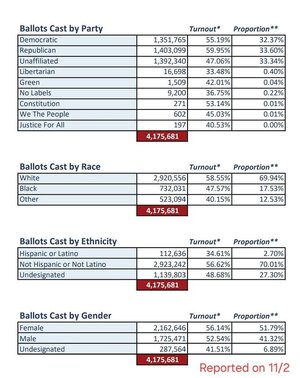
A million behind 2020 at this same point (going into the last day of early voting, not going into Election Day) means potentially a lot fewer votes this cycle, which suggests the low propensity blue turnout for Allred isn’t turning out.Wouldn’t that mean TX is on pace for about 500K more votes this year? I would think that’s not a good thing for Cruz.
Of course it could mean that Republicans are depressed by the awfulness of what their one-party state has wrought but Texas is a low turnout state these days and a lot of people there don’t see the point of bothering in the face of what looks like overwhelming odds.
- Messages
- 3,794
Ted Cruz probably breathing a sigh of relief.
not challenging you but wondering why you think the early voting number is a good sign for Cruz ?
RockyMtnHoo
Distinguished Member
- Messages
- 495
Ok, ouch…I read that wrong. I know flipping TX (POTUS or Senate) has always been kind of a mirage, but was hoping Dems would be driving higher turnout than that.A million behind 2020 at this same point (going into the last day of early voting, not going into Election Day) means potentially a lot fewer votes this cycle, which suggests the low propensity blue turnout for Allred isn’t turning out.
Of course it could mean that Republicans are depressed by the awfulness of what their one-party state has wrought but Texas is a low turnout state these days and a lot of people there don’t see the point of bothering in the face of what looks like overwhelming odds.
Share:


